pydantic-ai-viz
See what your Pydantic AI agents are (the blueprint) and what they do (the run) on one canvas, live or replayed. Draw any project's agents straight from its source code, without running a line of it. No API key, no account, and nothing leaves your machine.
Unofficial project
pydantic-ai-viz is a community project. It is not affiliated with or endorsed by Pydantic.
Try it in 10 seconds
-
See a demo
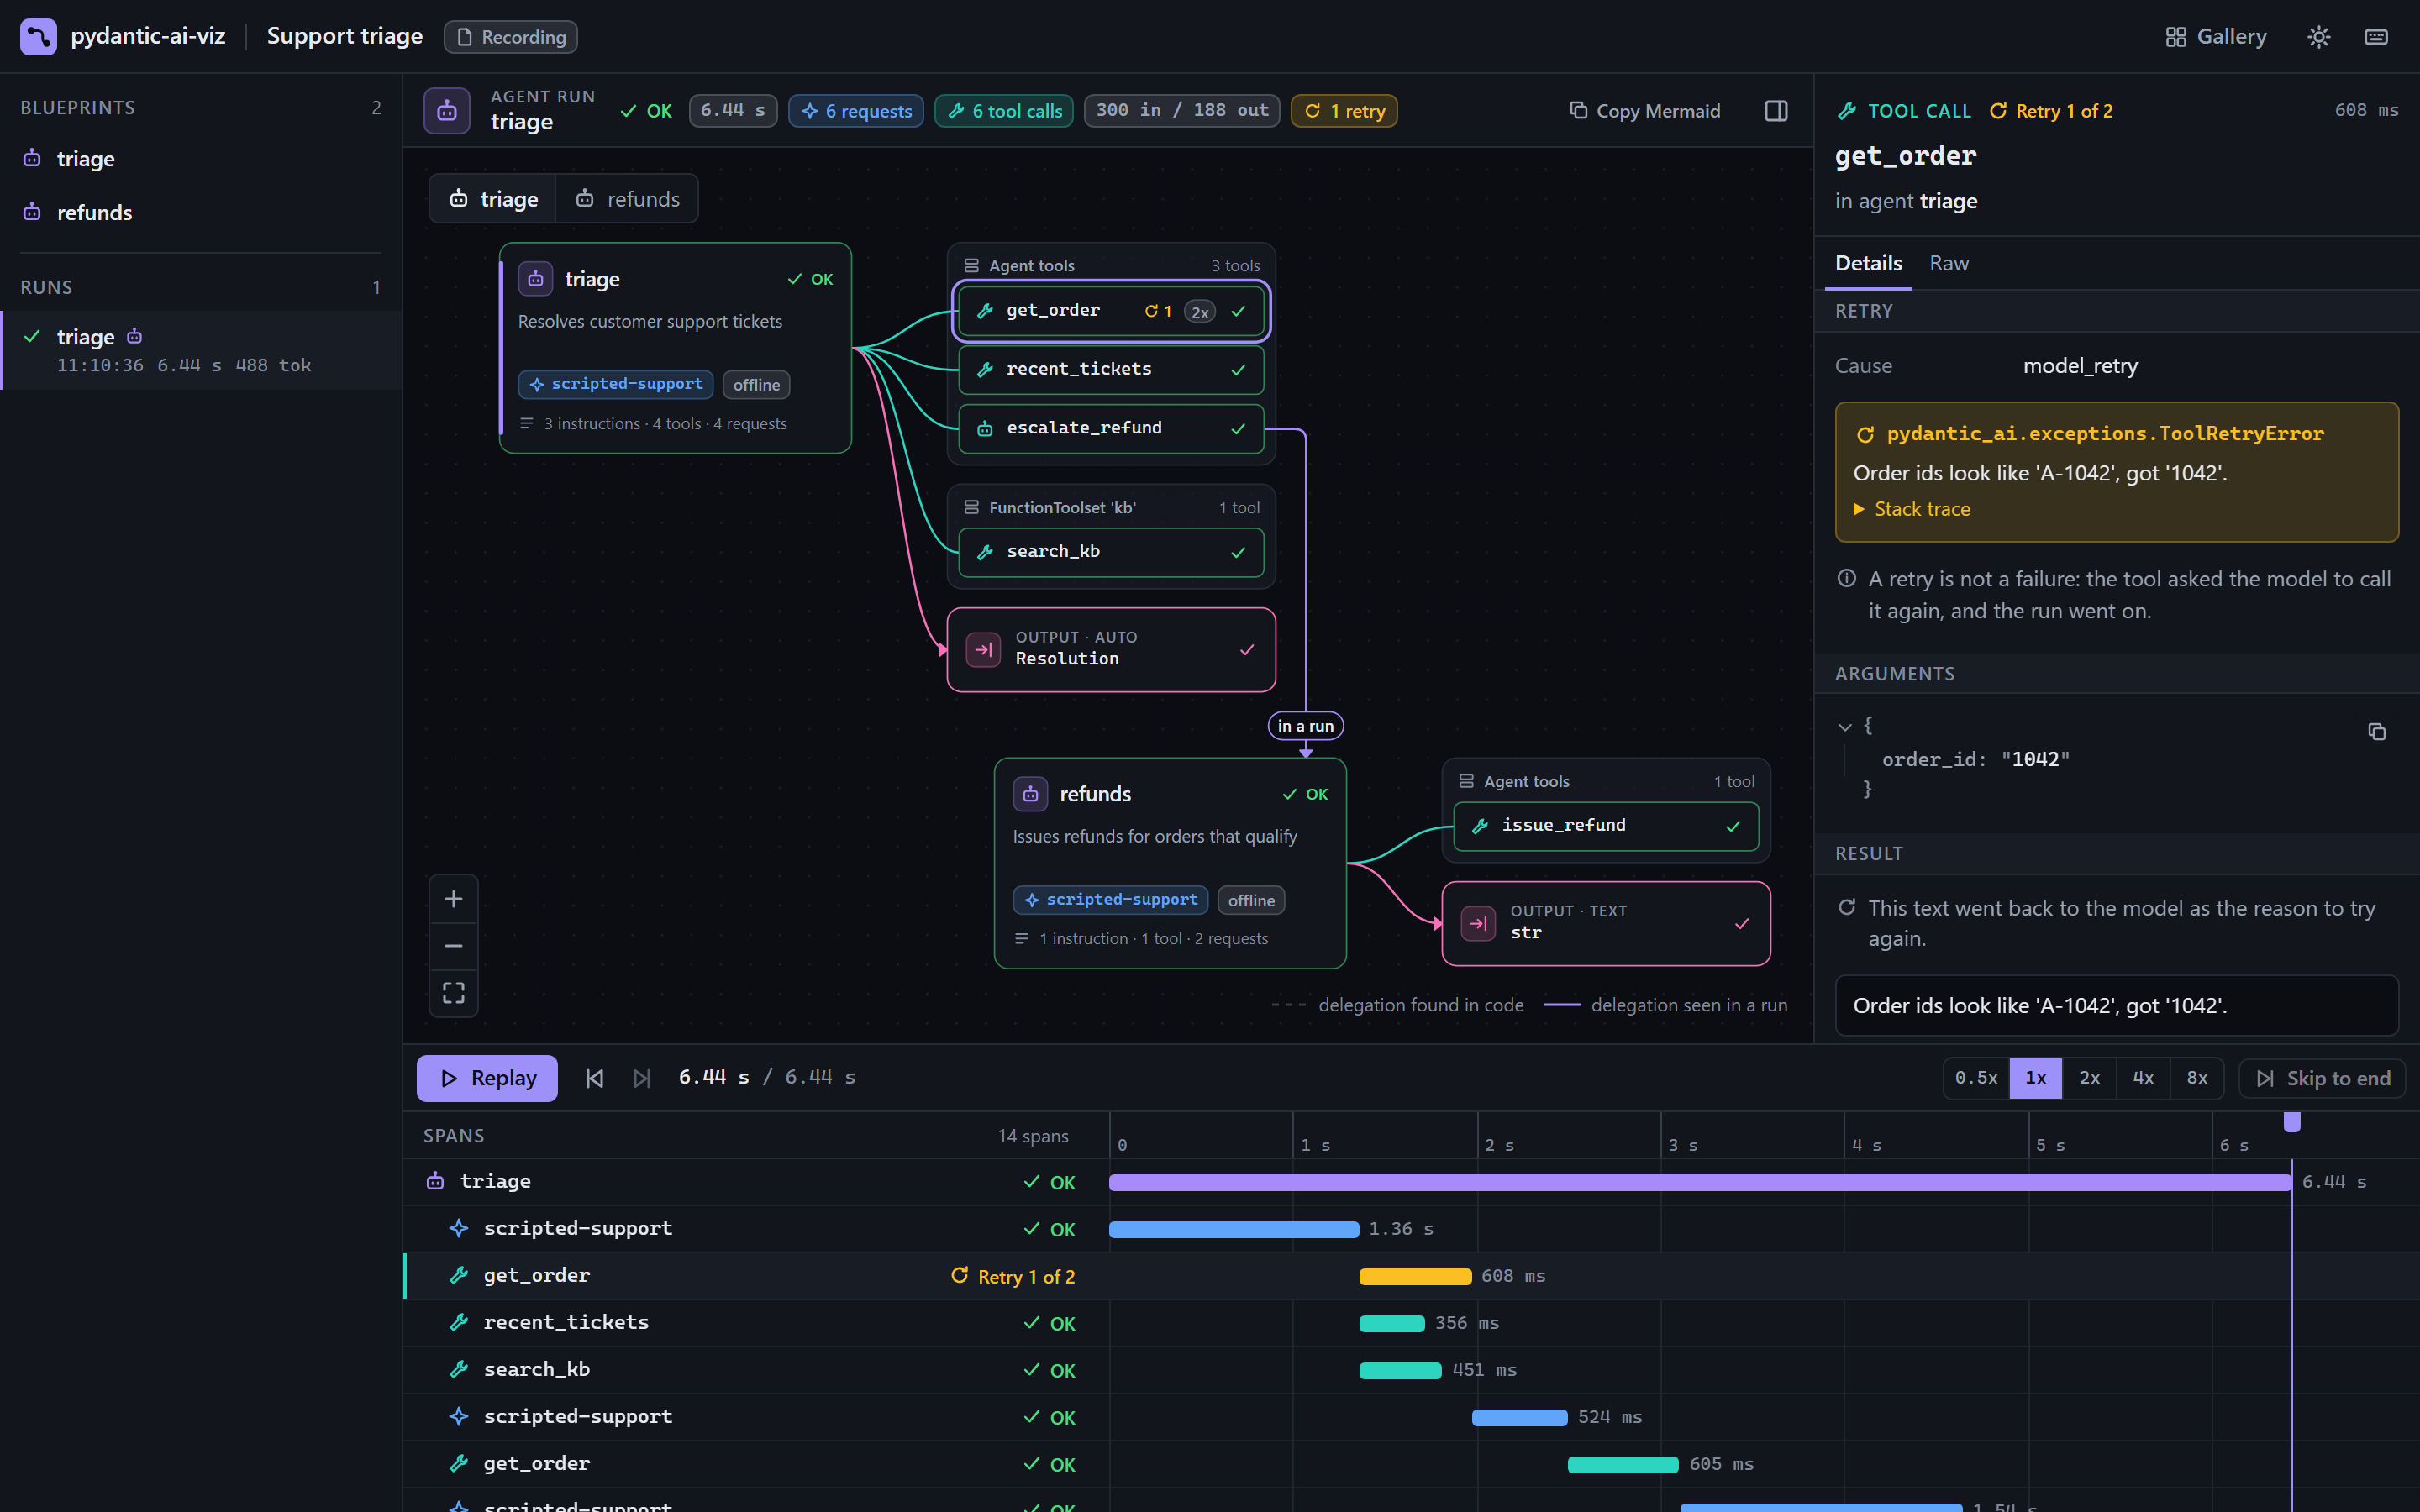
Plays a scripted support agent in your browser: streamed tokens, parallel tool calls, a retry, a delegation and a structured result. The model is scripted, so there is no API key and no network call.
-
See your own agents, with nothing executed
Run it in your project's directory. It draws every agent and graph in the project from its source code: model, instructions, tools with their schemas, output type and who delegates to whom. The code is parsed, never imported or run, so its dependencies need not be installed.
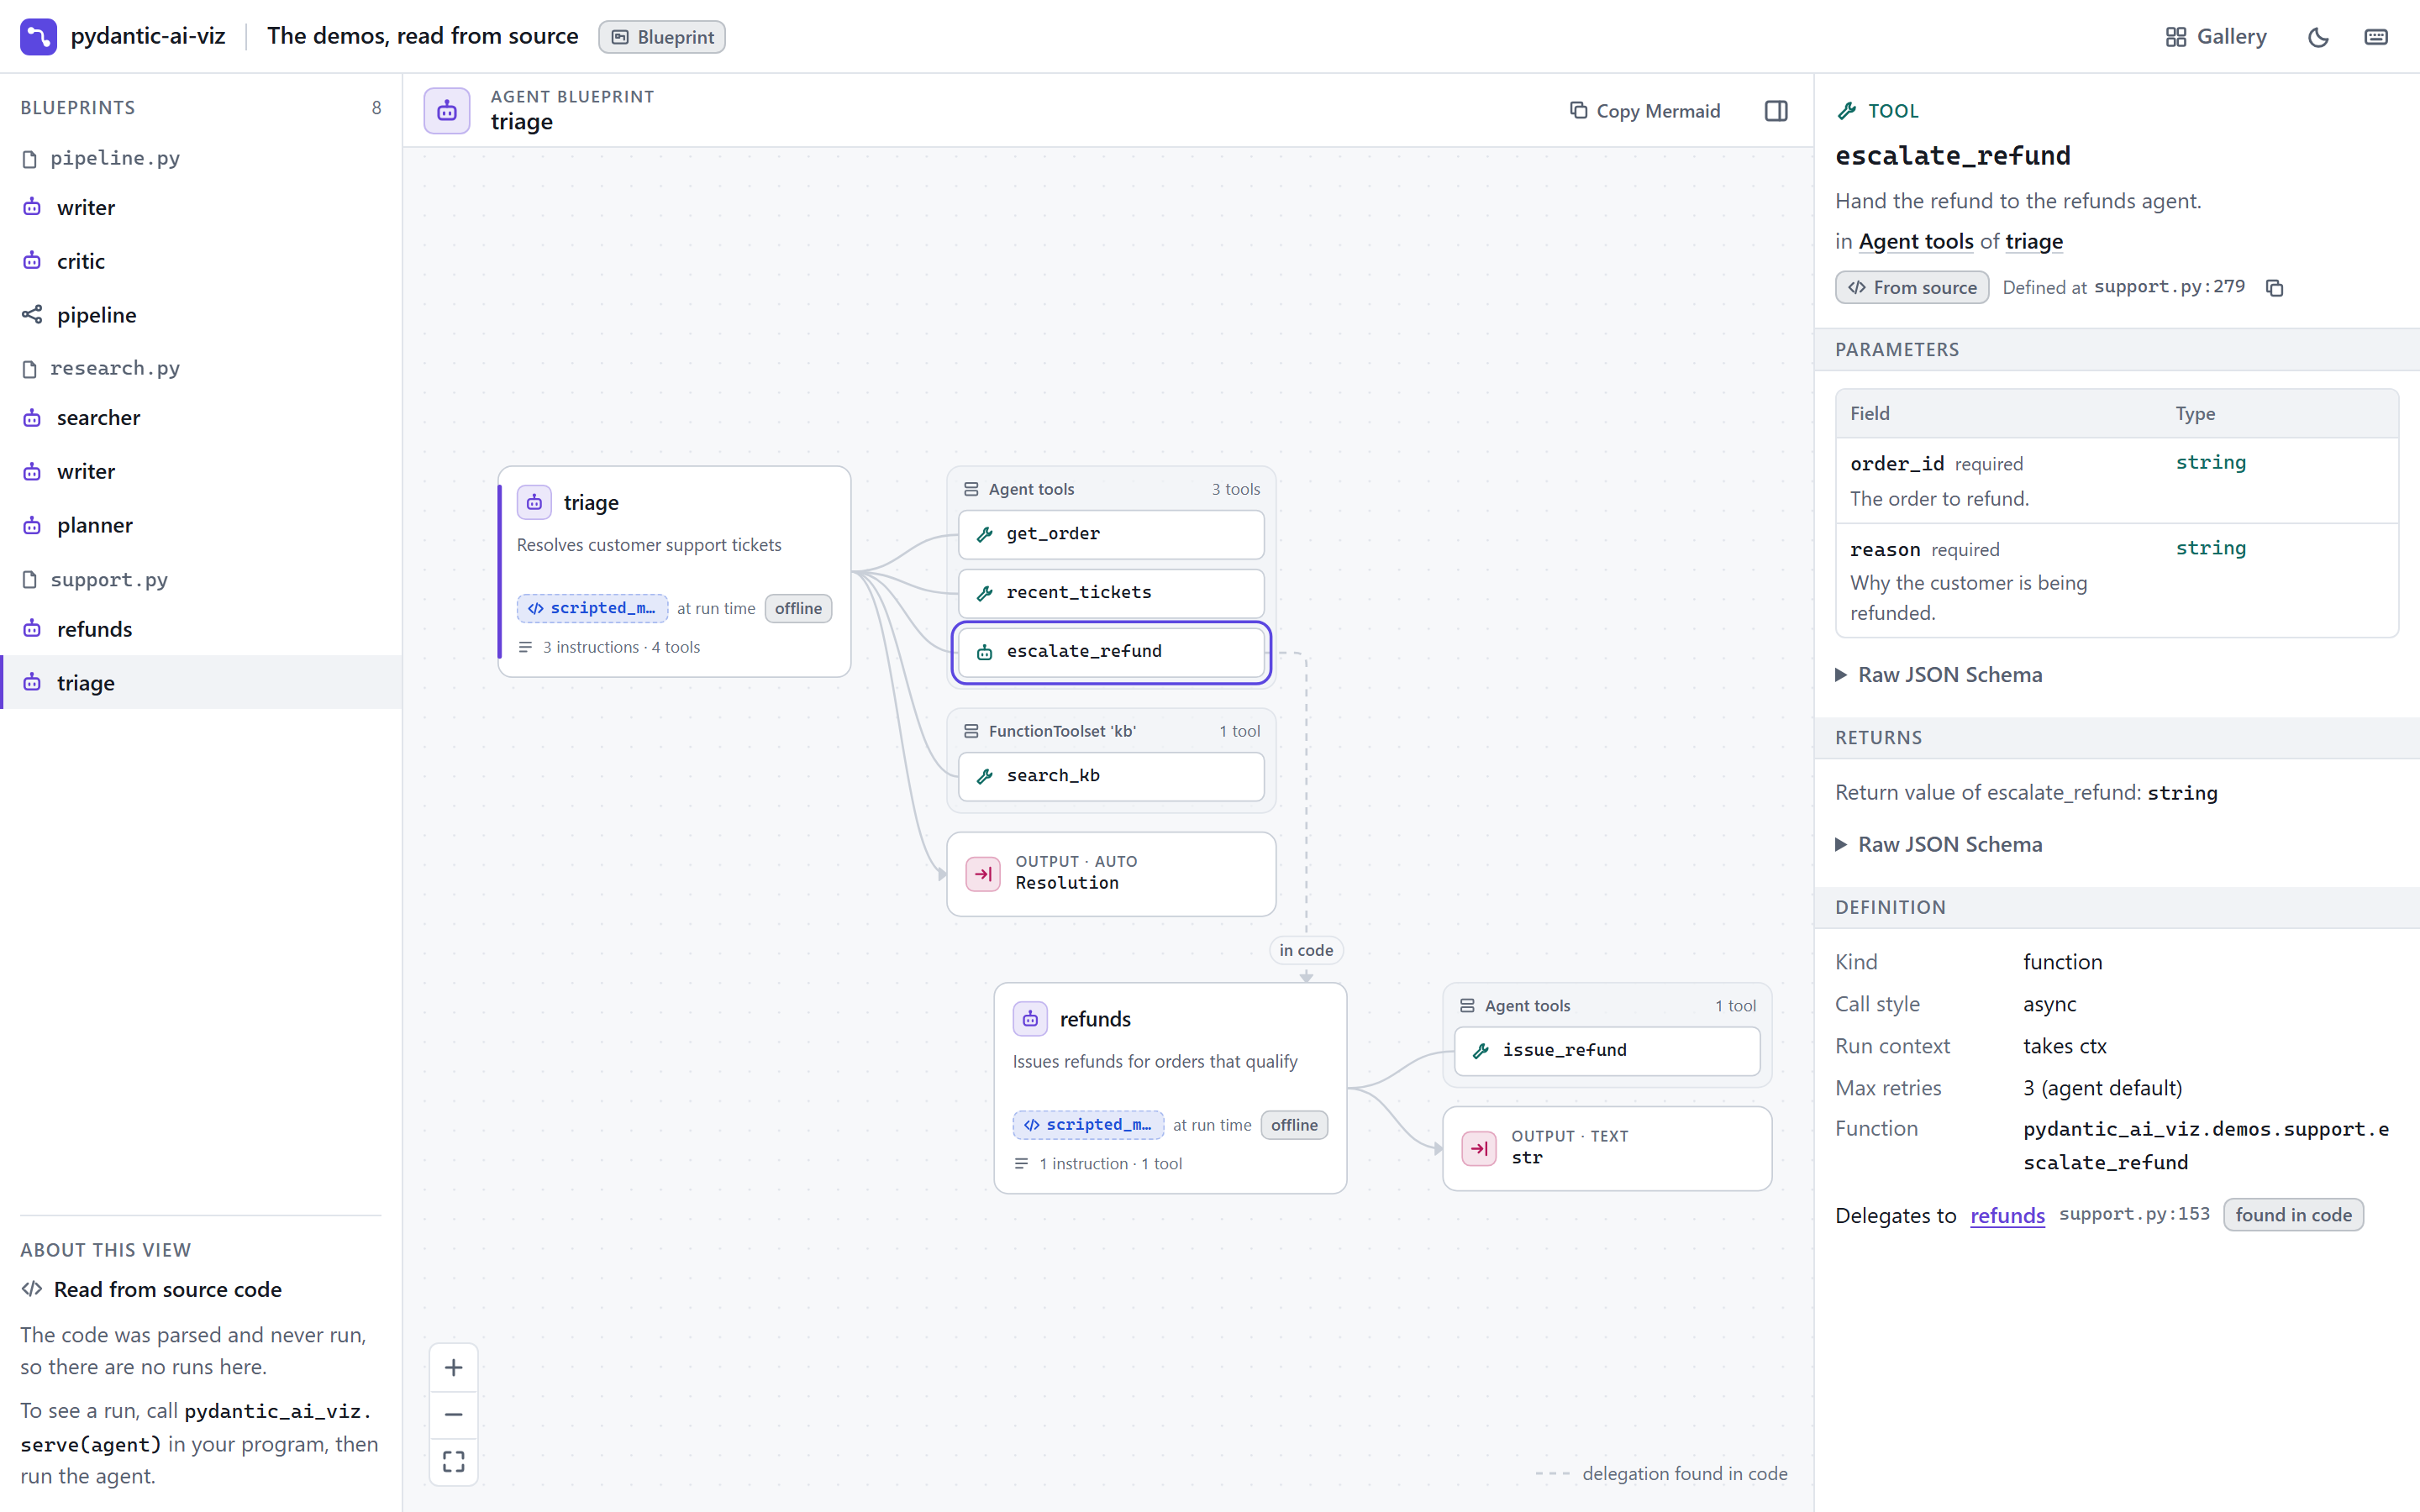
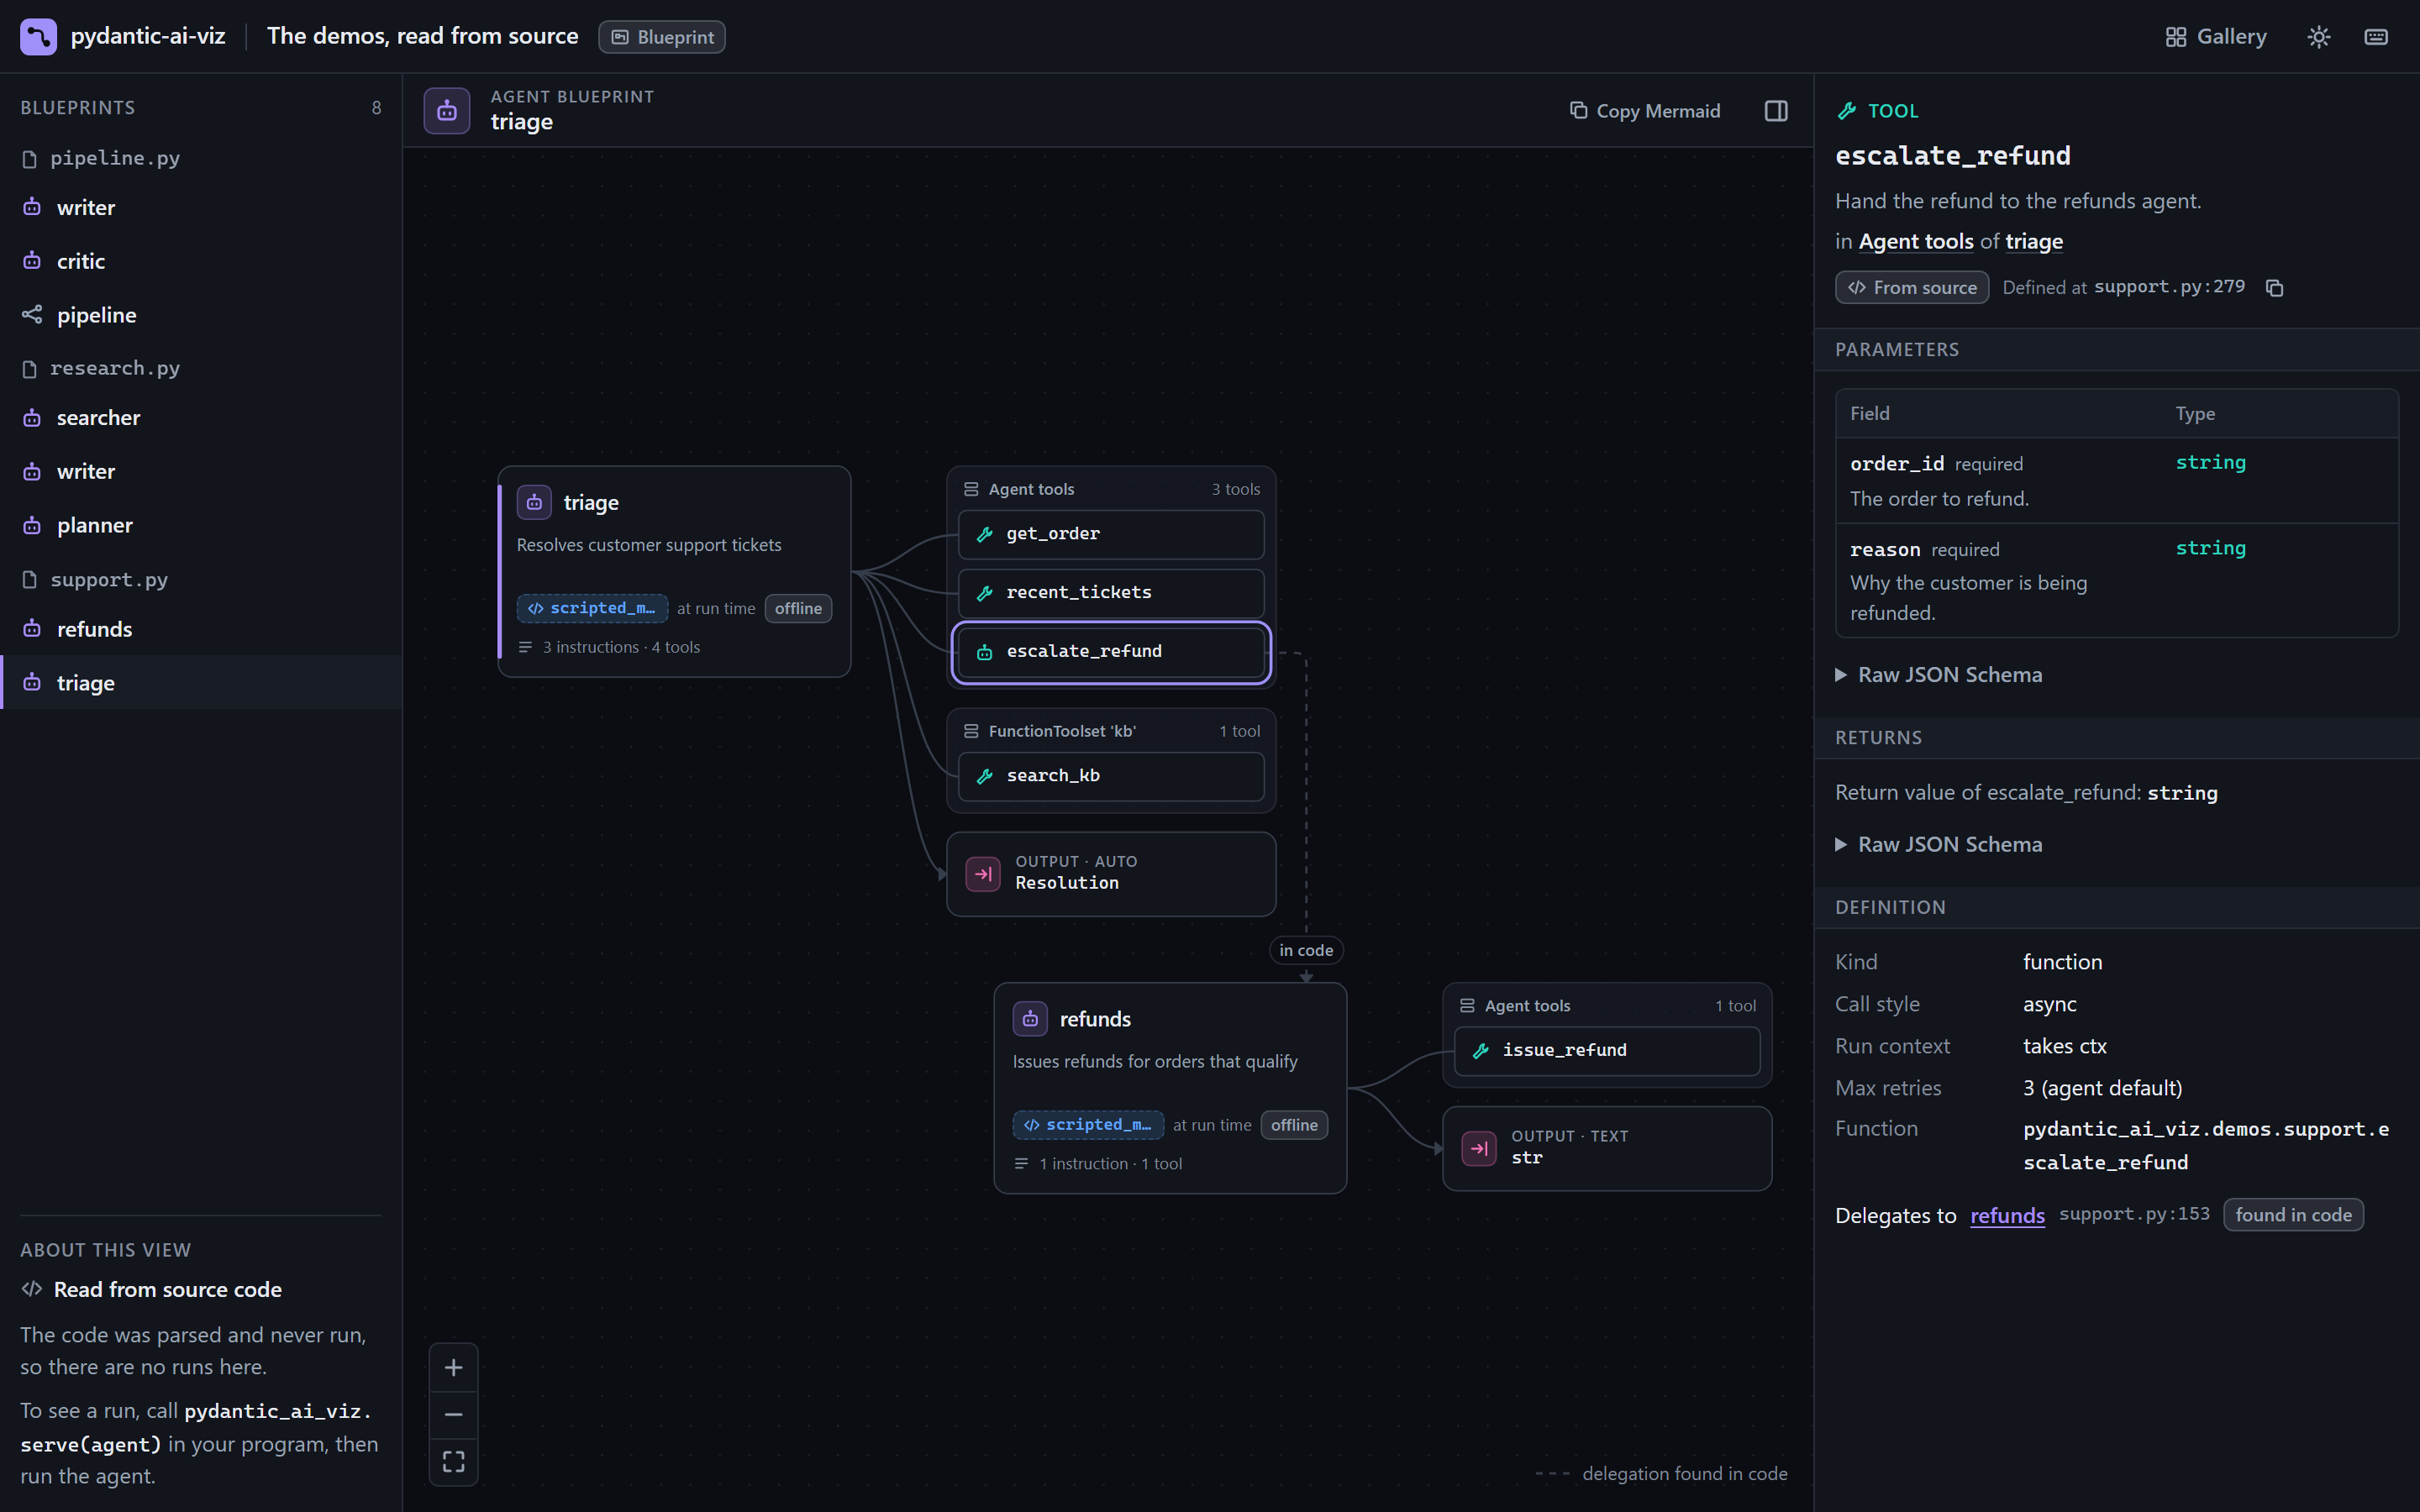
pydantic-ai-viz view src/pydantic_ai_viz/demos: the demos' source read, none of it run. Click the image to open it in the hosted viewer.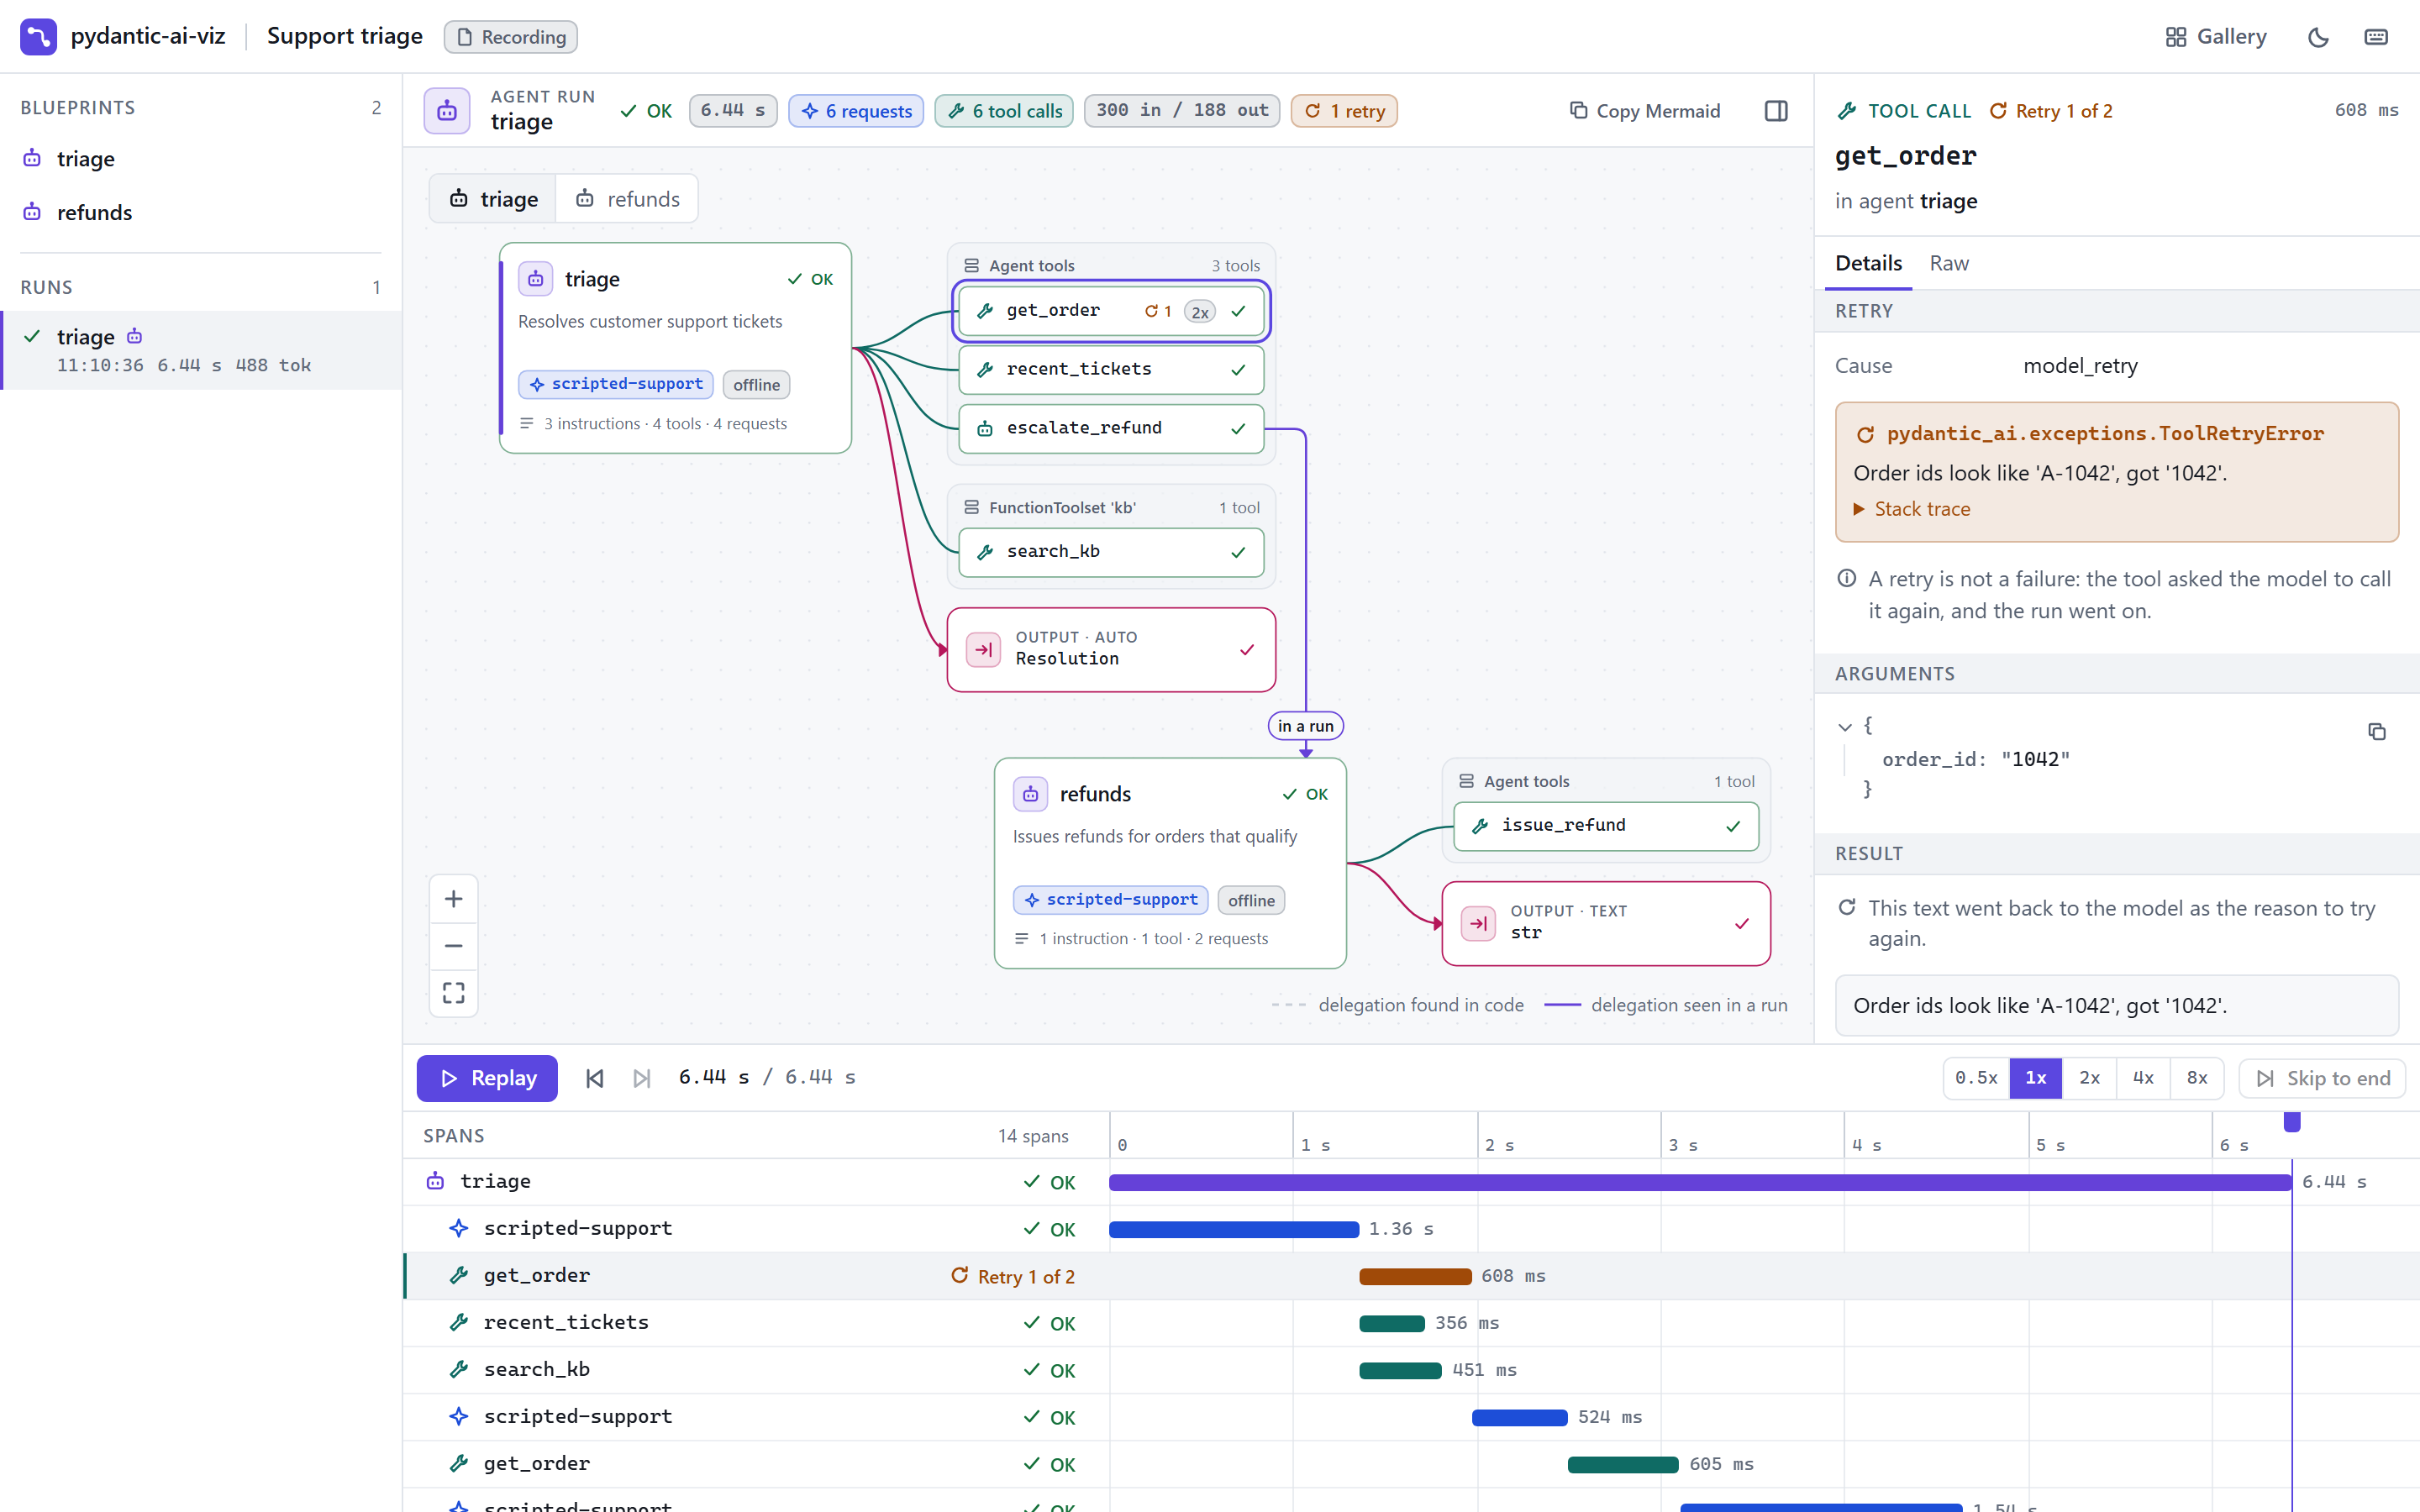
From the command line
A directory, a file (my_app/agents.py), one agent in it (my_app/agents.py:support_agent), a module name (my_app.agents) or a GitHub repository (gh:owner/repo). Imports between your files are followed. How view works
Or watch runs from Python, with one line around the code you already have:
import pydantic_ai_viz as pviz
from my_app import agent

with pviz.serve(agent, open_browser=True) as session:
    agent.run_sync("Where is my order?")
    session.wait()  # keep the viewer up until Ctrl+C
Quickstart Open the hosted demo
What it shows
- Blueprint from source
-
The agent as a diagram: model, instructions, toolsets, tools with JSON schemas, output type, retries and delegation to other agents, each with the file and line it is defined at. Read from your source code, across the files of a project, without importing or running any of it; a value only running the code could tell is shown as the code that computes it. Visualize an agent, How view works, Real-world examples
- Live runs
-
Model requests, tool calls, retries and sub-agent runs light up on the blueprint and stack up in a span timeline as they happen. You do not change how you call the agent. Watch live runs
- Inspector
-
Click any span to read the conversation, tool arguments and results, token usage and the raw span attributes.
- Graphs
-
pydantic-graphgraphs get a blueprint too, and one changed call site lights up the active node during a run. Graphs - Recordings and exports
-
Scrub back through any run. Save it as a
.pviz.jsonlrecording, or export one self-contained HTML file that opens offline. Export and share
What it is not
- Not a production tracing backend. It captures runs in one process and keeps them in memory. For production, use Pydantic Logfire. The two work side by side; see Use with Logfire.
- Not a chat playground. Pydantic AI already has
agent.to_web().
Requirements
Python 3.11 or newer and Pydantic AI 2.60 or newer (pydantic-ai-slim>=2.60,<3). See Compatibility for exactly what was tested.
Acknowledgements
The canvas is drawn with React Flow and laid out with dagre. The viewer is also built on React, Radix UI, Zustand and Tailwind CSS. The licence of every library bundled into the viewer is at the top of the viewer's HTML file, and of every export made from it.