Watch live runs
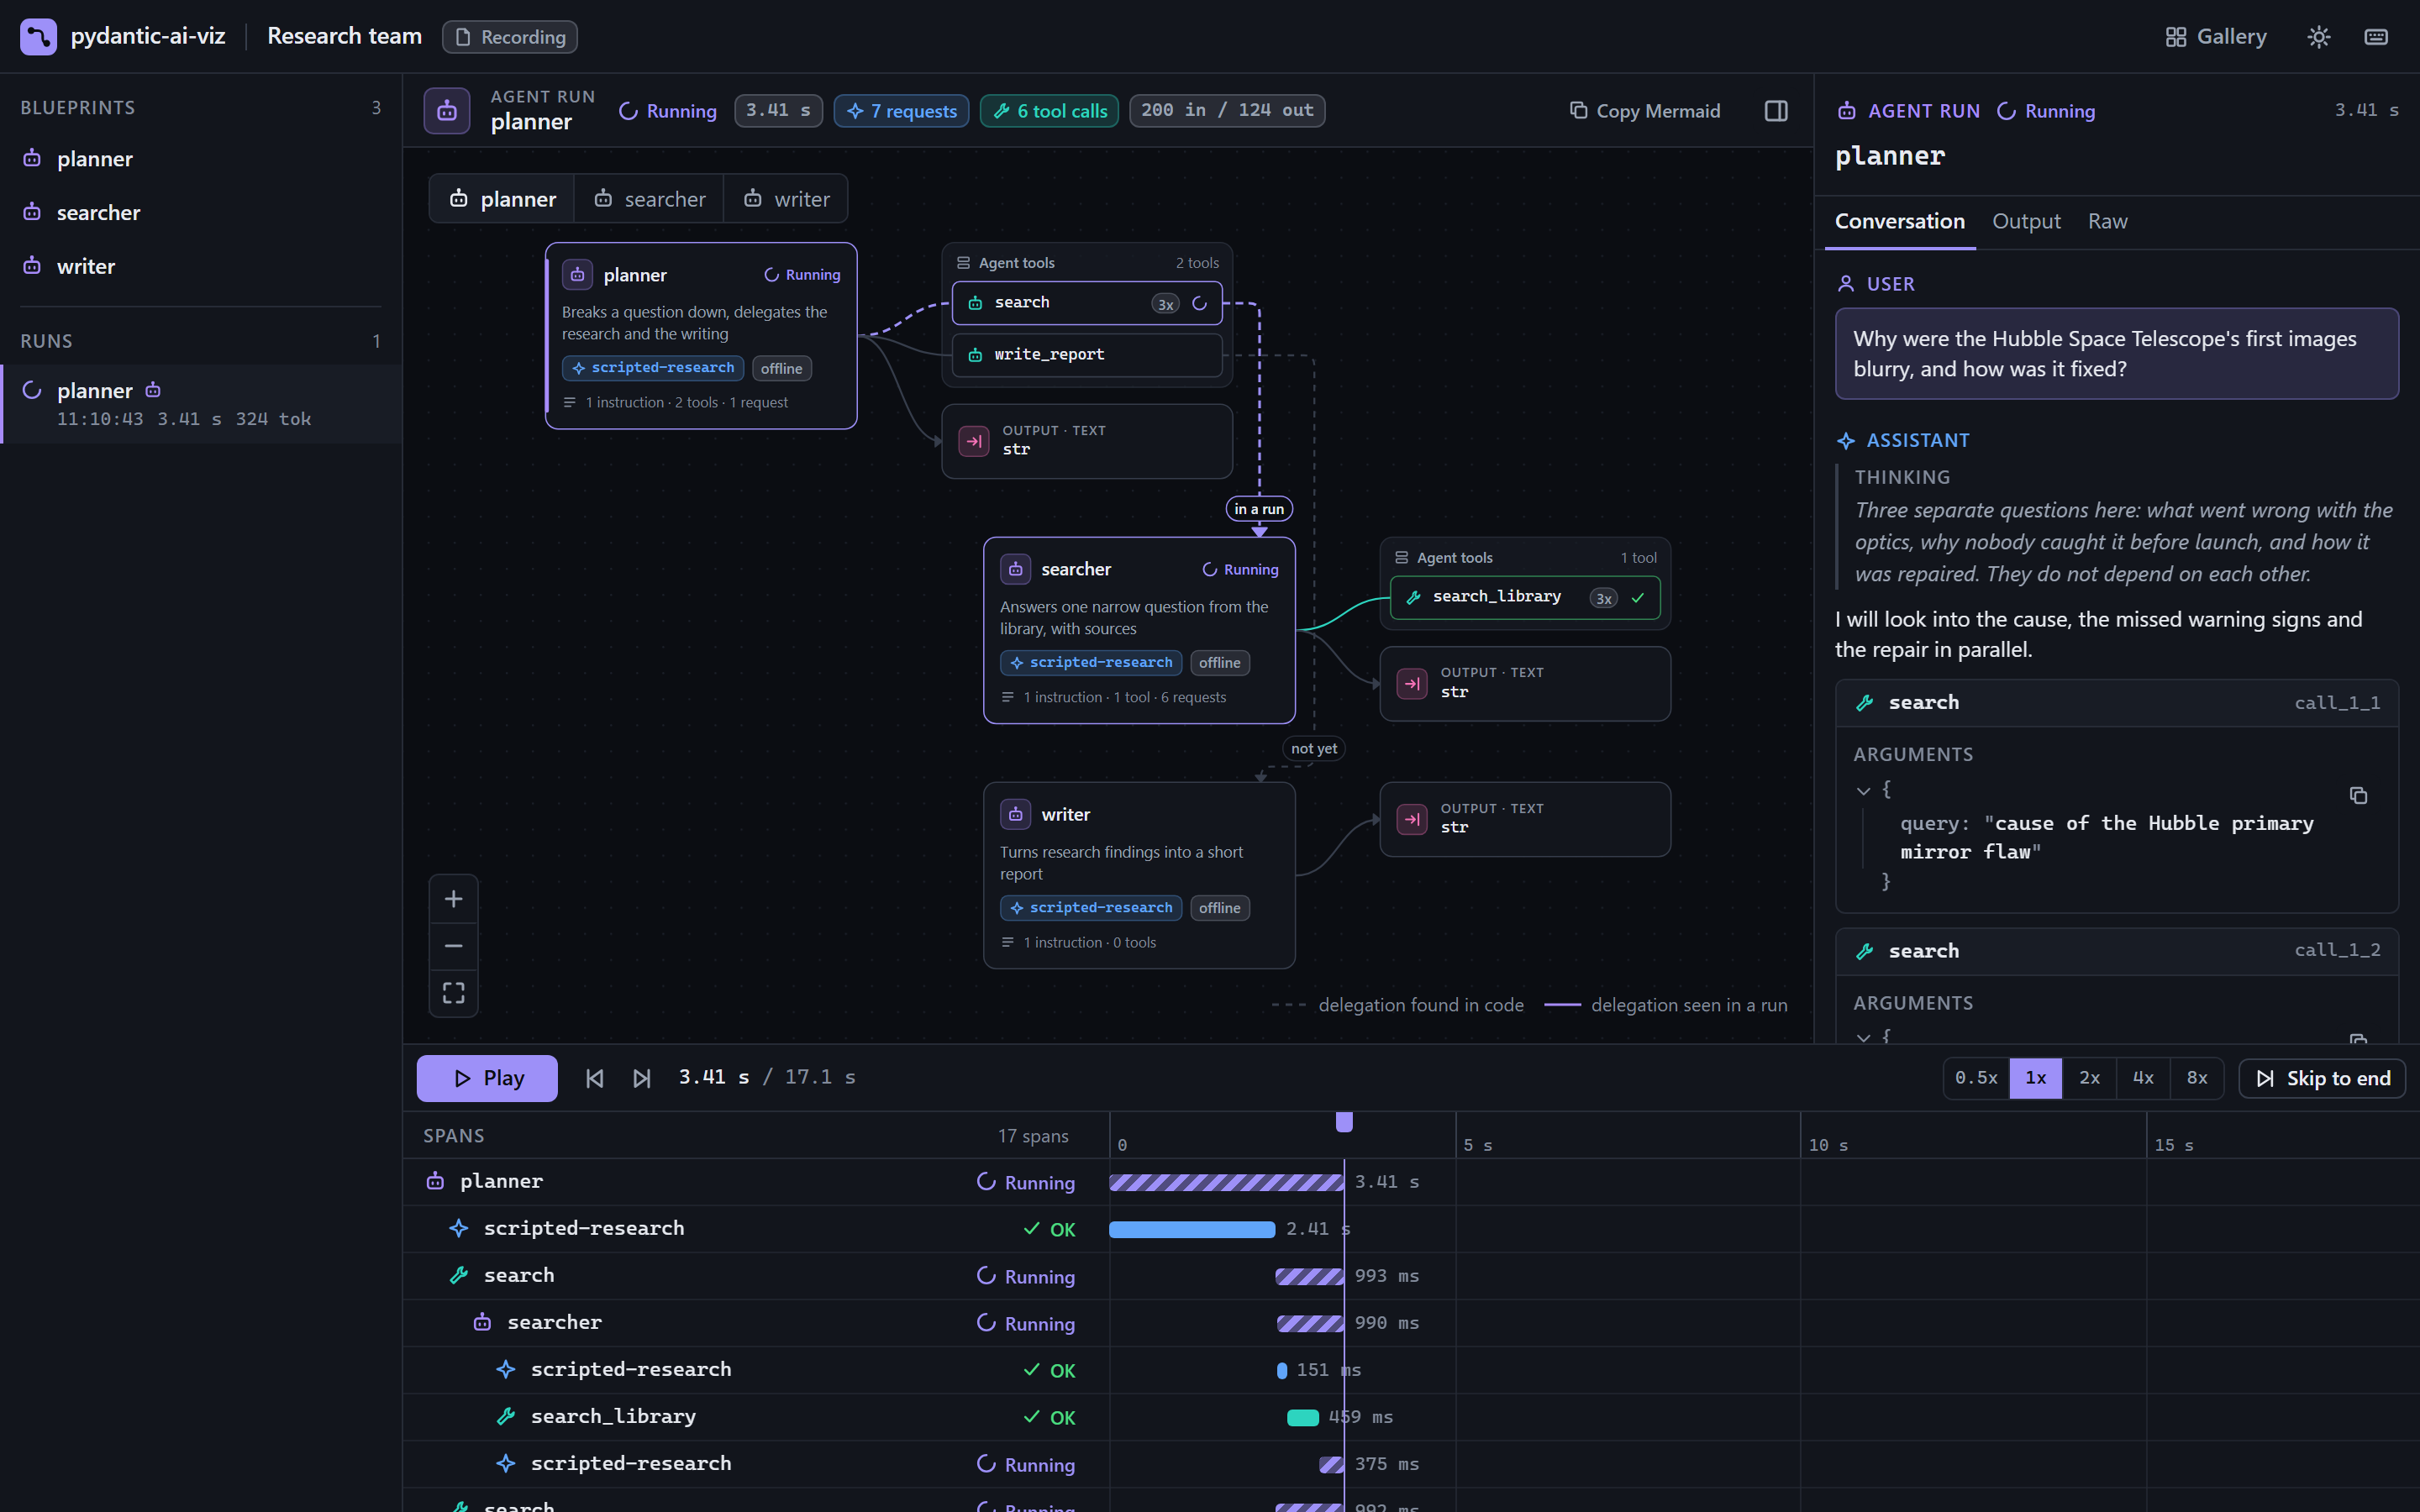
A run is one top-level agent run (or graph run) and everything that happens inside it: model requests, tool calls, retries and the runs of any agents it delegates to. pydantic-ai-viz captures runs in the process where your agents execute and draws them on the blueprint as they happen.
You do not wrap your agent or change how you call it. You start a session; from then on every agent run in the process is captured.
Start a session
import pydantic_ai_viz as pviz
from my_app.agents import support_agent

session = pviz.serve(support_agent, open_browser=True)
print(session.url)  # http://127.0.0.1:8765

result = support_agent.run_sync("Where is my order?")

session.wait()  # block until Ctrl+C so you can look around
session.close()
serve returns at once. The server runs in a background thread, so the rest of your program carries on, sync or async. A Session is also a context manager that closes itself:
run starts a session, then executes my_script.py as python my_script.py --customer 42 would (everything after the script path is passed to the script). When the script ends, the agents and graphs it defined at the top level are added as blueprints and the viewer stays up until you press Ctrl+C. If the script raises, the traceback is printed and the viewer stays up, so you can see what led to the failure.
Options go before the script path:
All flags are in the CLI reference.
What you pass to serve
The positional arguments are targets: the things you want drawn before any run happens.
| Target | Effect |
|---|---|
An Agent |
Its blueprint is drawn. Agents it delegates to, as far as the code shows, are drawn too. |
A Graph |
Its graph blueprint is drawn. |
| A module | Every agent and graph defined at the top level of the module is drawn. |
| Nothing | The canvas starts empty and fills in as agents run. |
Targets only decide what is drawn up front. Capture is process-wide either way: an agent you did not pass still shows up when it first runs, with a blueprint built from what the run reveals. Blueprint vs run explains the difference in detail.
You can add targets later with session.register(...). Registering the same object twice does nothing.
The keyword arguments:
| Argument | Default | Meaning |
|---|---|---|
host |
"127.0.0.1" |
Address to bind. Anything other than loopback exposes your prompts to the network; see Privacy. |
port |
8765 |
Port to bind. If it is busy, a free port is chosen instead. 0 always picks a free port. Read the real address from session.url. |
open_browser |
False |
Open the viewer in your default browser. |
include_content |
True |
Capture prompts, tool arguments and results. False keeps structure, timing and token counts only. |
stream |
False |
Show tokens as they arrive. Read Token streaming before turning it on. |
instrument |
True |
Turn on Pydantic AI's instrumentation for you. Set False if you configure it yourself; see Use with Logfire. |
title |
None |
Shown in the viewer's top bar and used as the file name of downloads. |
max_events |
50_000 |
Size of the in-memory event log. See Long sessions. |
What appears, and when
Each step of a run is a span. The viewer learns about a span twice: when it starts and when it ends. That is why some details show up immediately and others only when a step finishes.
| Moment | What you see |
|---|---|
| An agent run starts | A new entry under Runs in the sidebar. The agent's card is marked running. |
| A model request starts | The model chip on the agent card pulses. A row appears in the timeline with the model name. With stream=True, the response text fills in token by token. |
| A model request ends | The full response, the input messages, the resolved instructions and the token usage of that request. |
| A tool call starts | The tool node is marked running, and its arguments are already available. Tool calls made in the same model response appear as siblings in the timeline, overlapping in time. |
| A tool call ends | The result. If the tool raised ModelRetry, the node turns amber and shows the attempt number; the next attempt is a new row. A tool that fails for good is red. |
| A tool runs another agent | A nested agent run appears under the tool call, and the delegation edge on the canvas turns from dashed to solid. |
| The agent run ends | The final output, the whole conversation, and the run's own token usage. On success the output node lights up. |
Two details that are easy to trip over:
- The output tool has no row of its own. When an agent returns structured output through a tool such as
final_result, Pydantic AI does not emit a span for that call. The viewer lights the output node when the run ends successfully, and the call is visible in the conversation. - Amber is a retry, red is an error. A
ModelRetryis the agent working as designed, so it never shows red.
The run's token total in the sidebar is the sum over its model requests, including those of delegated agents, counted once each.
Read a run
Select a row in the timeline (or press J and K) to inspect it. A click on a canvas node selects the latest span of that tool, model or agent. With nothing selected, the inspector shows the run itself.
| Selection | Inspector tabs (and the sections in them) |
|---|---|
| Agent run | Conversation; Output (Output, Usage); Raw |
| Model request | Response (Request, Response); Input (Instructions, Input messages); Raw |
| Tool call | Details (Retry or Error, Arguments, Result); Raw |
| Graph run, graph node | Details (Inputs, Output); Raw |
Raw shows the OpenTelemetry attributes of the span that were not turned into something more readable, which is useful when you want to know exactly what Pydantic AI recorded.
When a run involves several agents, the switcher above the canvas chooses whose blueprint you are looking at. It starts on the agent that began the run.
Go back in time
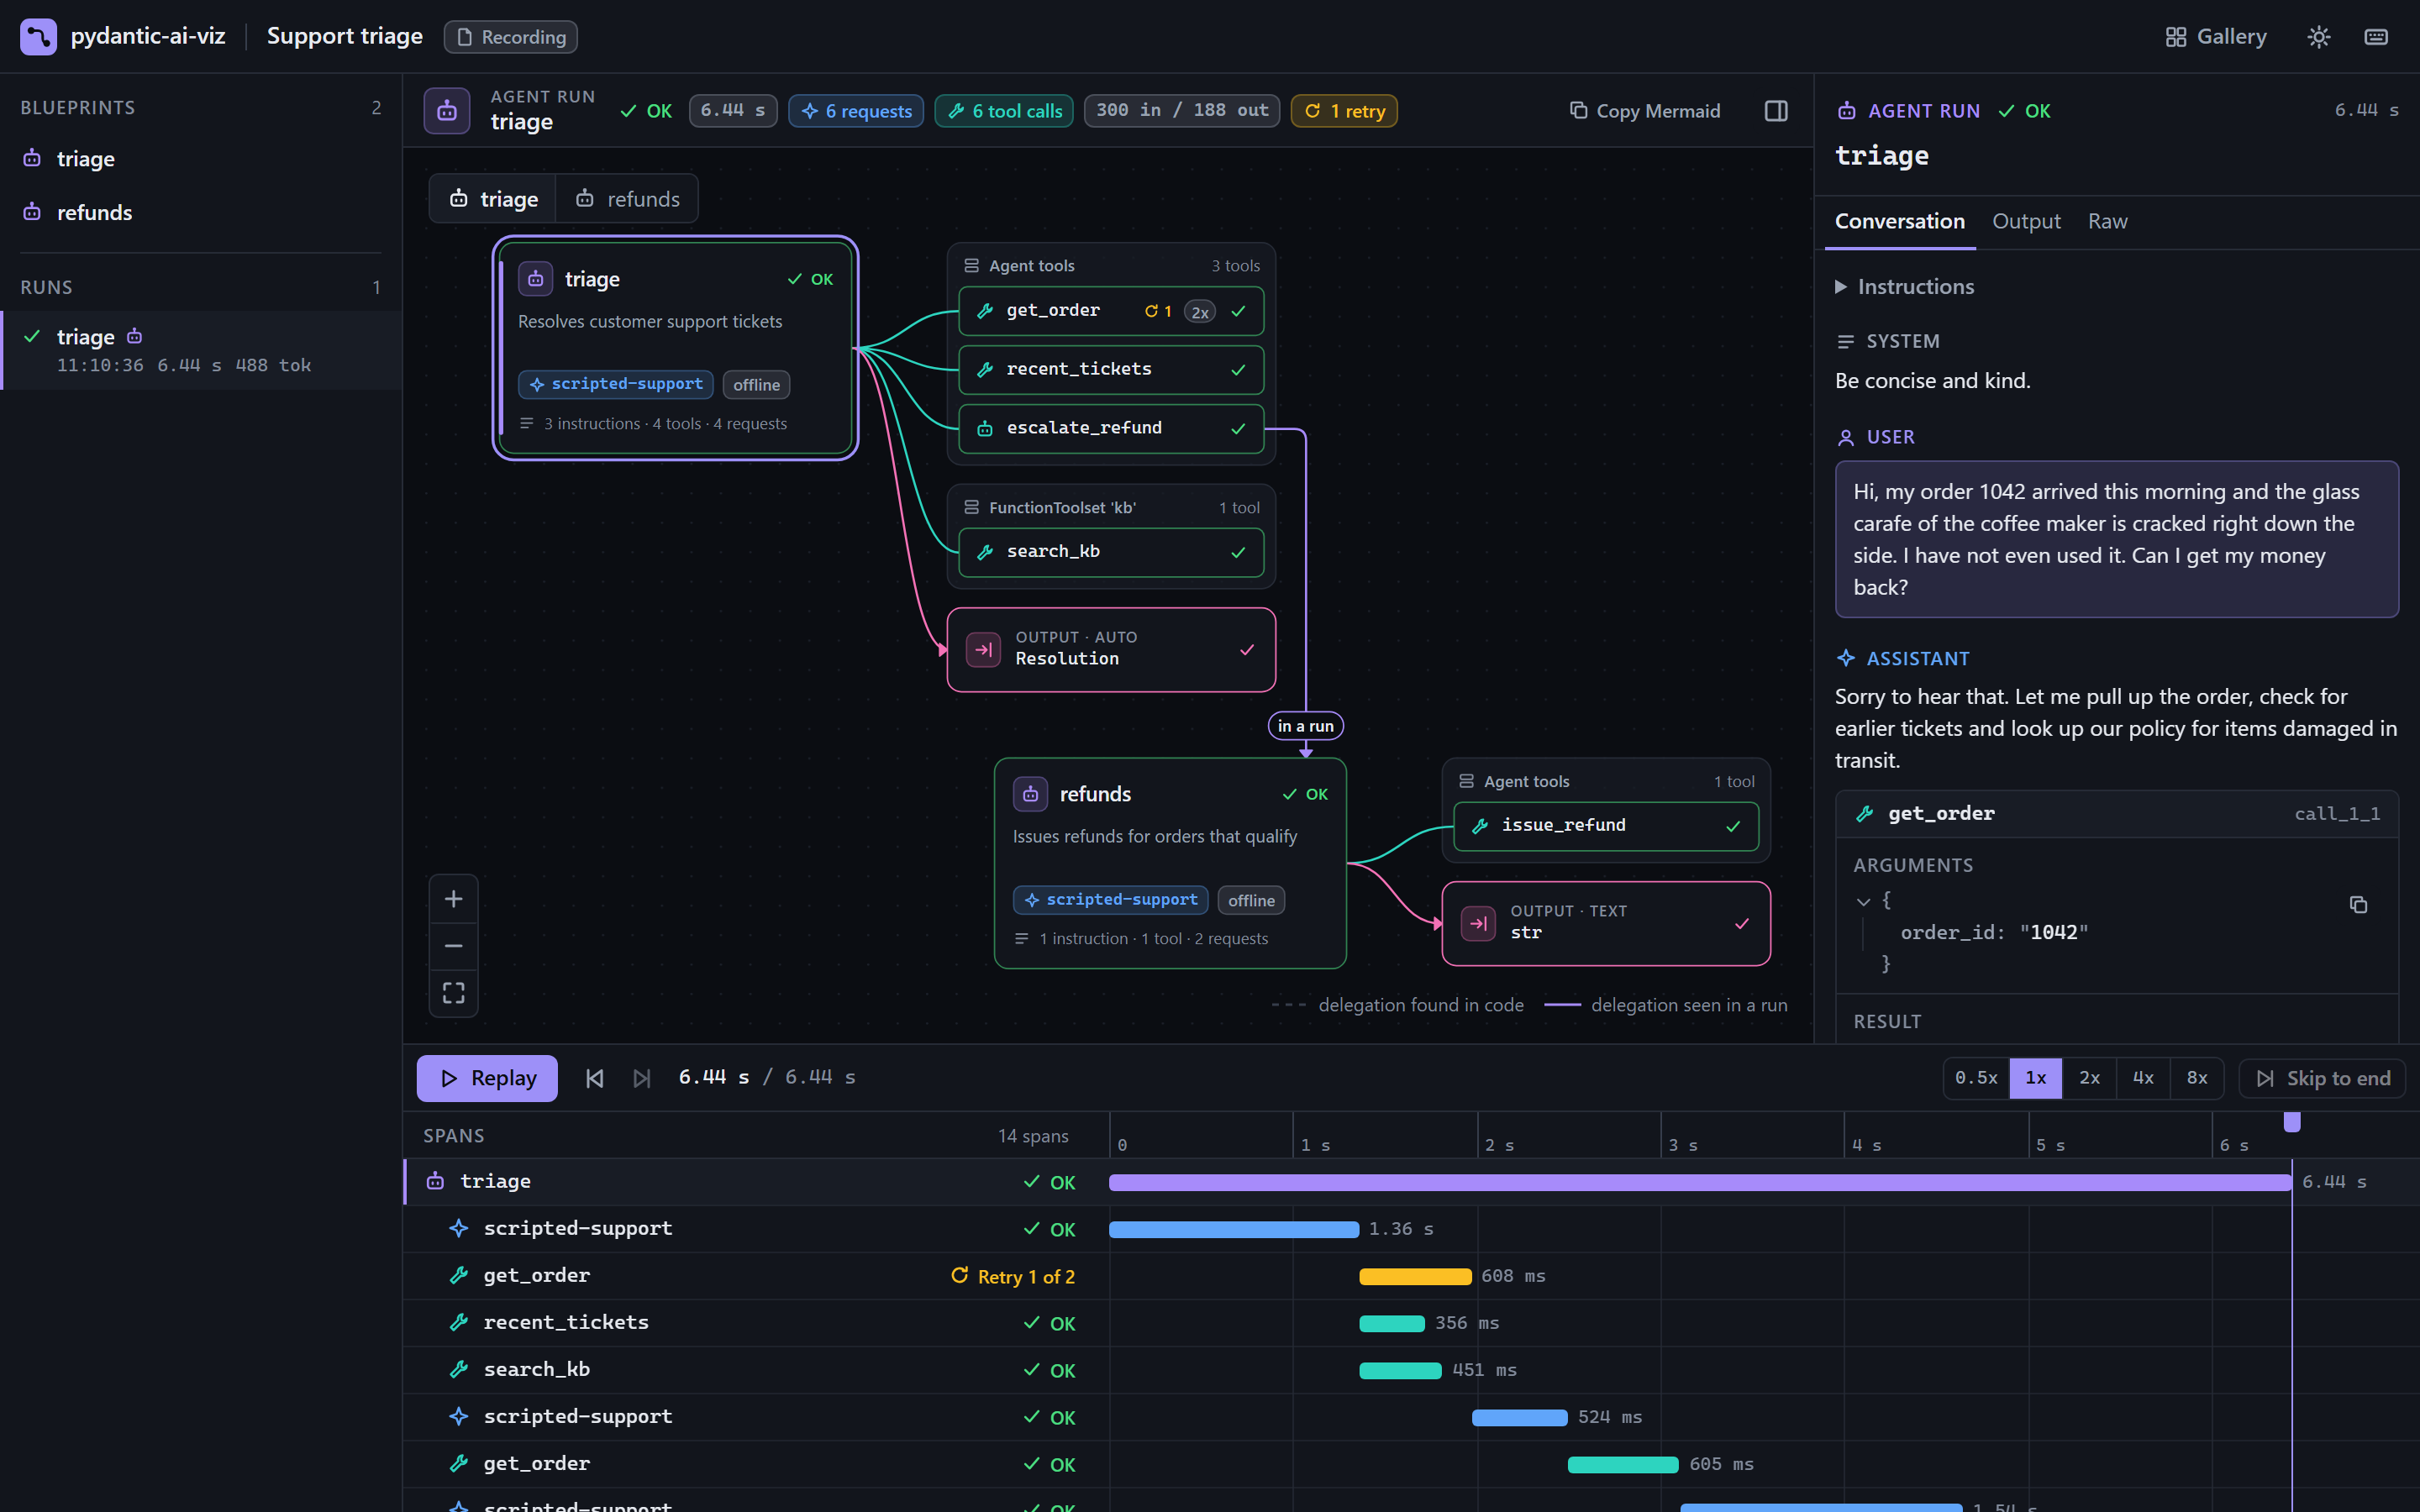
The ruler along the top of the timeline is the scrubber, and the playback bar above it has play, step and speed controls. Dragging the ruler back shows the canvas, the timeline and the inspector exactly as they were at that moment, including half-streamed text. A recording plays from the start when you open it, unless the link points at a span: then the run opens held at its end with that span selected. In a live session, new events still arrive while you are watching the past; press L or the Live button to jump back to now.
| Key | Action |
|---|---|
| Space | Play or pause |
| Left / Right | Step to the previous or next span boundary |
| [ / ] | Slower or faster (0.5x to 8x) |
| J / K | Next or previous span |
| L | Jump to live |
| F | Fit the canvas |
| T | Toggle light and dark |
| Esc | Clear the selection |
| ? | Show all shortcuts |
One session at a time
A session that instruments Pydantic AI does so for the whole process, so only one can be active. Starting a second one raises:
Close the first session (or leave its with block) before starting another. In tests, use record as a context manager so each test cleans up after itself.
Long sessions
Events are kept in memory, in the process that called serve. Nothing is written to disk unless you save or export.
When the log grows past max_events, the oldest finished runs are dropped, a whole run at a time. Blueprints are never dropped, a run that is still going is never cut in half, and the run that finished last is always kept, even when it alone is larger than the limit. For a service that runs for days, the viewer therefore always shows the most recent runs. Raise max_events if you need a longer history and have the memory for it.
Very long strings (over 32,768 characters) are cut, with a note saying how long the original was.
Limits
- One process. Runs are captured where they happen. If your agents run in worker processes, start a session in each worker, or use Logfire, which is built for that.
- An agent with its own instrumentation setting is not captured. A per-agent setting (
agent.instrument = ..., anInstrumentationcapability or anInstrumentedModel) takes precedence over the process-wide one thatserveinstalls. See Troubleshooting. servereplaces the process-wide instrumentation setting. If you already callAgent.instrument_all(...)or use Logfire, follow Use with Logfire instead.- Graph runs need one changed line. Agent runs inside a graph are captured like any other, but to see the graph's own nodes light up you call the graph through
run_graph. See Graphs.