Graphs
pydantic-ai-viz draws pydantic-graph graphs built with GraphBuilder: the blueprint without running anything, and the active node during a run.
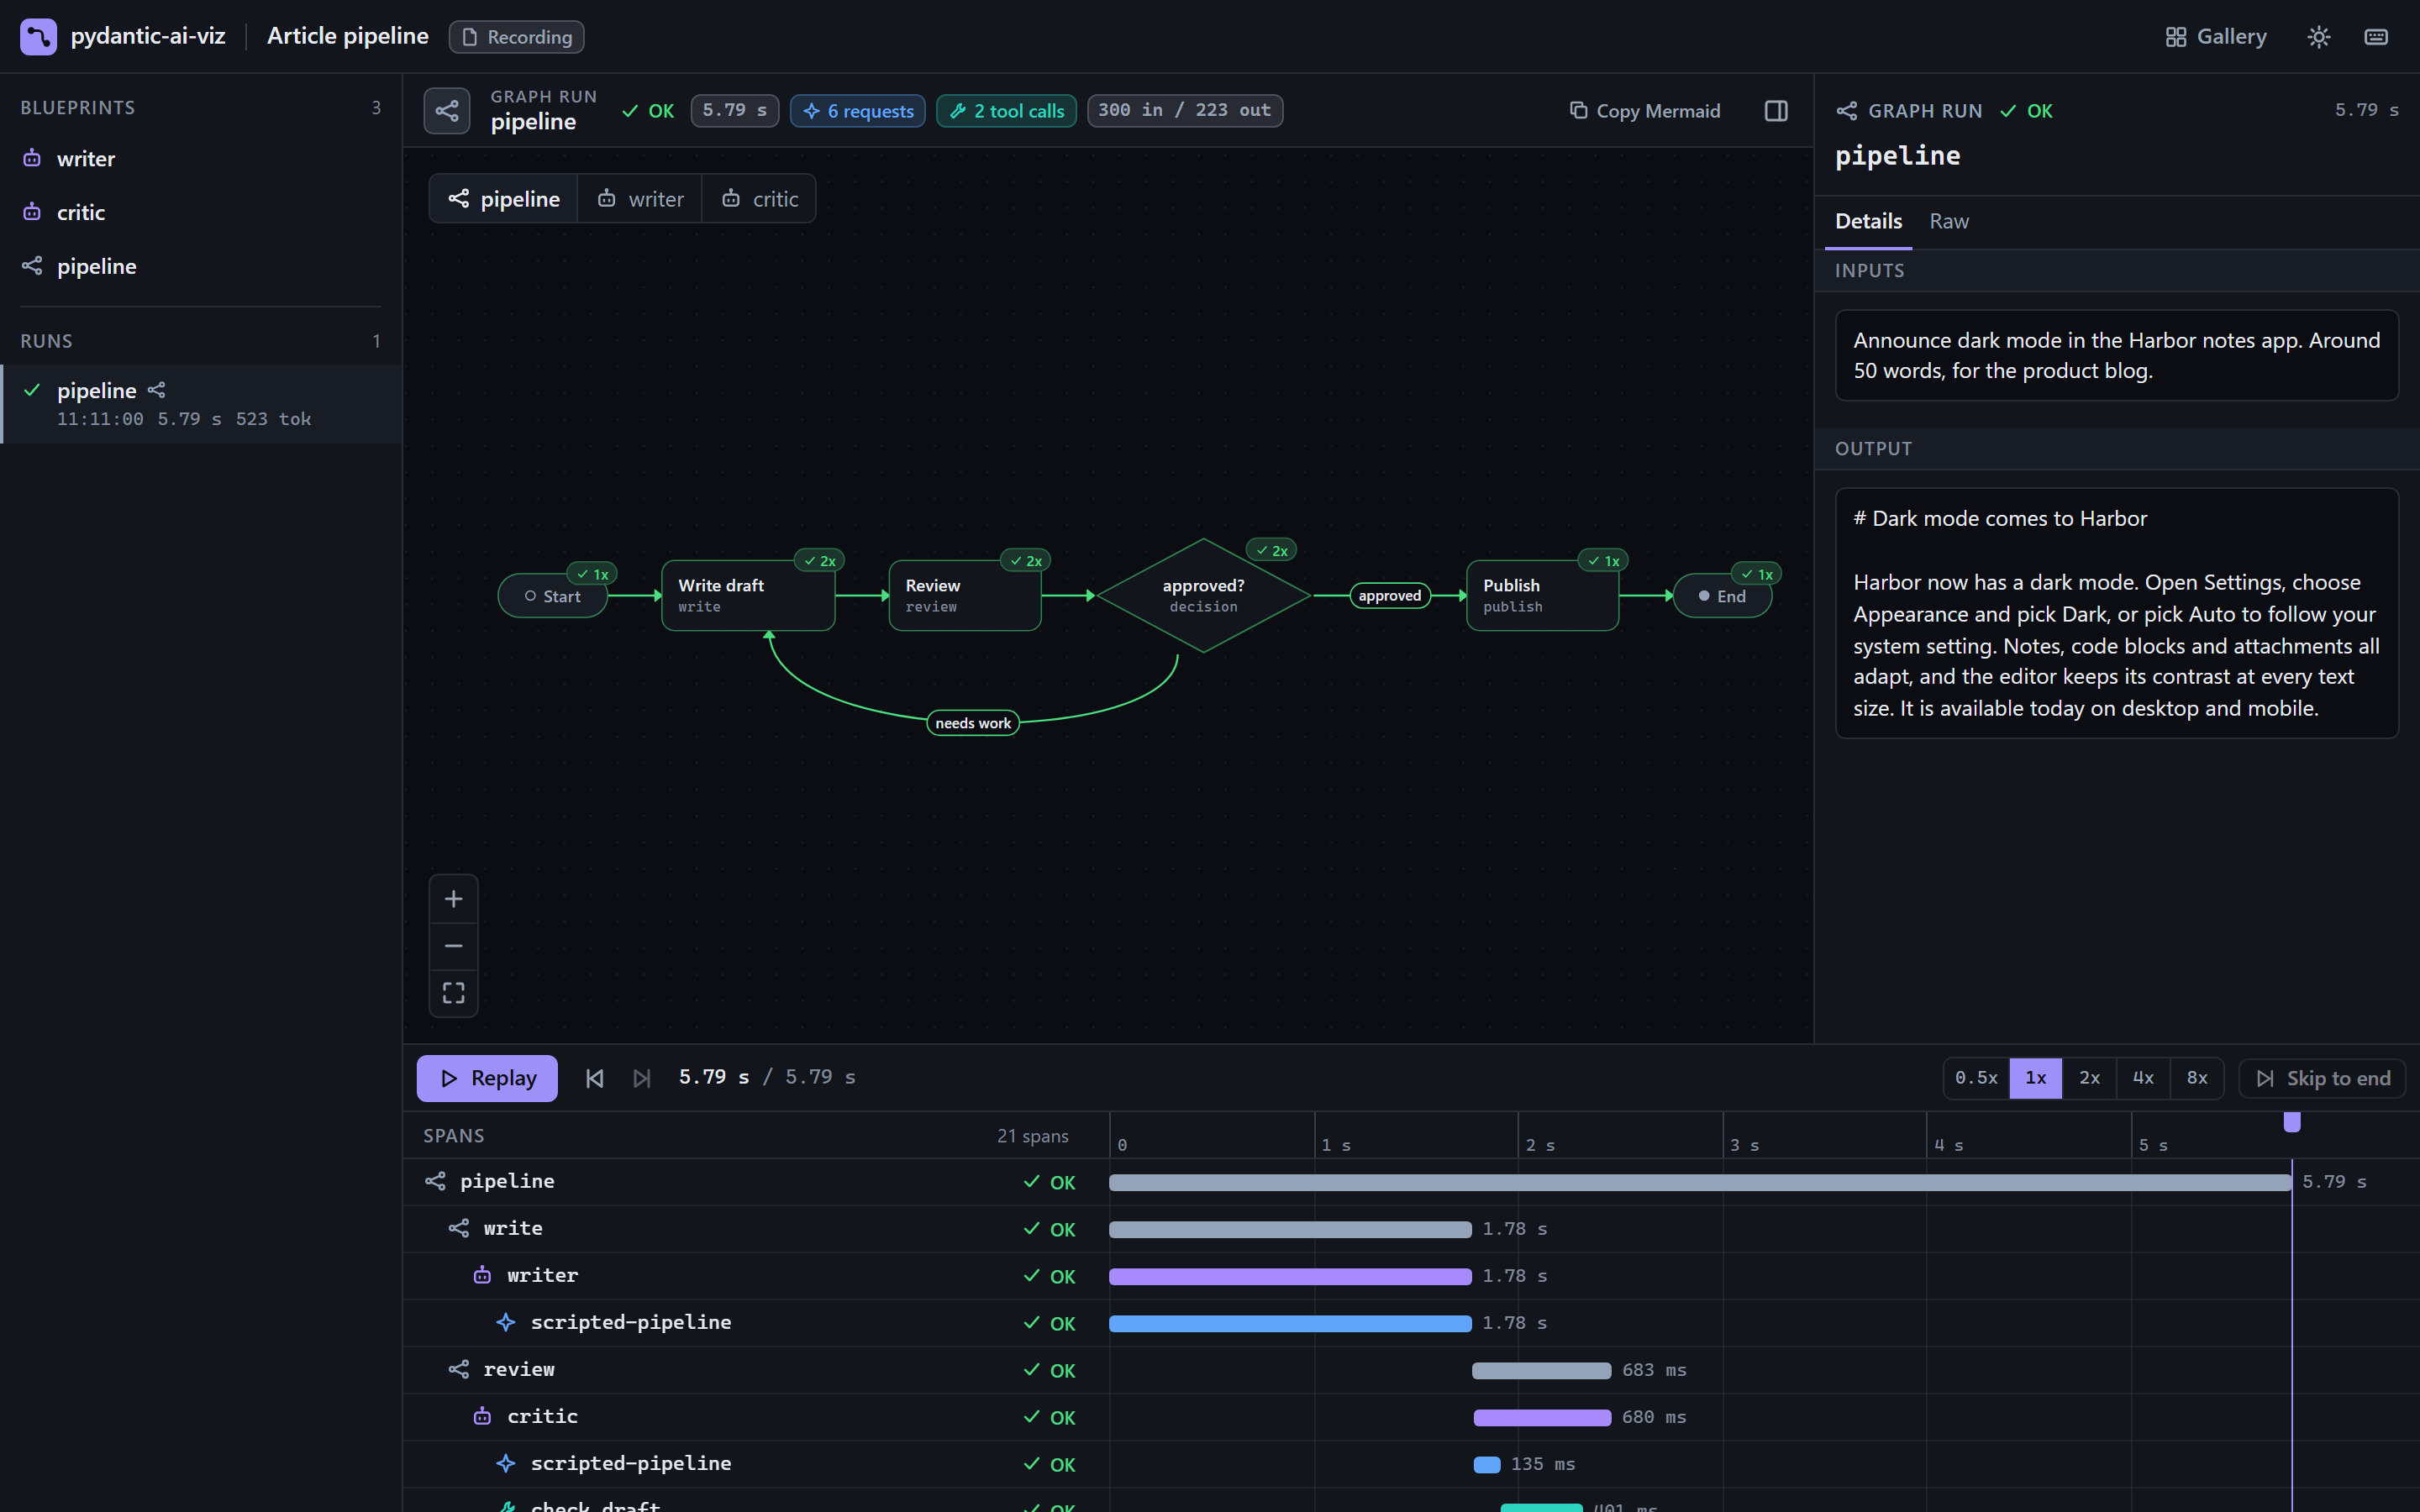
Draw a graph
A file that builds a graph is a target like one that defines an agent. It is read, not run:
import pydantic_ai_viz as pviz
from my_app.pipeline import graph

bp = pviz.blueprint(graph)  # a GraphBlueprint
print([node.id for node in bp.nodes])
print(bp.mermaid)  # the same text as graph.render(direction="LR")
On the canvas:
| Shape | Node |
|---|---|
| Pill | Start and end |
| Card | A step, with its label if it has one |
| Diamond | A decision, with its note (for example "approved?") |
| Labelled edge | A decision branch, with the branch label |
Joins, broadcasts and maps are drawn as cards with their kind. The Copy Mermaid button copies the stateDiagram-v2 text, ready to paste into a README or a pull request.
Watch a graph run
Agent runs are captured without touching your code. Graph runs are different: pydantic-graph reports its own progress only through Logfire, so there is nothing for a plain OpenTelemetry processor to pick up. To see graph nodes light up, change the one line that runs the graph:
import asyncio

import pydantic_ai_viz as pviz
from my_app.pipeline import Draft, graph

session = pviz.serve(graph, open_browser=True)

# before: output = asyncio.run(graph.run(state=Draft(), inputs="Announce dark mode"))
output = asyncio.run(pviz.run_graph(graph, state=Draft(), inputs="Announce dark mode"))

session.wait()  # keep the viewer up until Ctrl+C
Inside code that is already async, the line is output = await pviz.run_graph(...).
run_graph takes the same state, deps and inputs as graph.run and returns the graph's output. While it runs:
- the graph run is the root of a new run in the sidebar,
- each node the graph executes is highlighted and gets a row in the timeline, with its inputs,
- a node that is visited again (a loop) shows a visit count,
- agent runs started inside a step are nested under that step, so you can open a node and read the conversation that happened in it.
If the graph raises, the graph run is marked as an error and the exception is raised to you unchanged. A run that is cancelled (the task is cancelled, or you press Ctrl+C) is marked as an error too, with the message cancelled, together with the nodes that were still running.
run_graph is safe to leave in
run_graph looks for a session in this order: the session= argument, then the active session, and if there is neither it simply calls graph.run(...). Code that uses it behaves the same in production, where no session exists, as it did before.
async def run_pipeline(brief: str) -> str:
    return await pviz.run_graph(graph, state=Draft(), inputs=brief)
The graph is registered with the session the first time it runs, so passing it to serve is optional. Passing it just makes the blueprint visible before the first run.
Give the graph a name (GraphBuilder(name="pipeline", ...)). An unnamed graph is labelled with its variable name when it was found in a module or file, and graph-1, graph-2, ... otherwise; run_graph does not let pydantic-graph guess a name from the calling code.
Limit: parallel steps
When a graph runs several steps at once (after a broadcast or a map), agent runs started in those steps are shown under the graph run, not under the step that started them.
The reason is how nesting works. A span becomes the parent of what happens next by being the "current" span, and there can only be one current span at a time on the task that drives the graph. With one step running, pydantic-ai-viz makes that step's span current, and agent runs inside it nest correctly. With several steps running at once, no single one of them can be current, so their agent runs attach one level up.
Every node still gets its row and every agent run is still captured with its full detail; the indentation in the timeline is just coarser for a parallel batch. A step that follows a parallel one runs alone in its branch, so agent runs inside it nest under it again.
Two more things are less exact while steps run in parallel. pydantic-graph announces the steps that follow from a finished step, but not which step that was, so pydantic-ai-viz works it out from the structure of the graph:
- A failure is shown on the graph run. If a step raises while other steps are still running, the graph run is marked as an error and carries the exception, and no node is. With one step running, the node that raised is marked too.
- End times can be approximate. A node's row ends when the step after it is announced. In the rare case where that cannot be matched to a node (a join that cancels its remaining branches, for example), the row ends later than the step did.
Sequential graphs, including ones with decisions and loops, nest and time exactly.
Other things to know
- Only
run_graphproduces graph spans. A plaingraph.run(...)still shows the agent runs inside it, as separate runs, but no graph nodes. - Node inputs and the graph output are captured as JSON. Values that are not JSON-serializable are shown as their
repr. Withinclude_content=Falsethey are left out. - If you already send graph spans to Logfire, those are Logfire's own spans. In the viewer they appear as plain rows, not as graph nodes. See Use with Logfire.
- The
pipelinedemo is a graph with a review loop and an agent inside each step:pydantic-ai-viz demo pipeline.